products for monitoring and diagnostics of machinery
A(M)Cademy of VIBROdiagnostics
#11 How to approach vibrodiagnostics?
In this post, we would like to present a broader perspective on the application of various systems that utilize the measurement of mechanical vibrations. Such systems serve different functions and are designed for different machines. It is crucial to match the monitoring system with the device. By doing so, on the one hand, we can avoid expenses on an overly advanced system, and on the other hand, we can prevent excessive cost-cutting if we decide on a solution that does not provide the basic functions necessary to maintain the operation of the considered machine. In the worst-case scenario, a poorly chosen system cannot detect its malfunctions.
What to measure?
First and foremost, it is important to remember that systems based on “vibration” measurement will help us maintain the machine in good technical condition only as long as the damages primarily generate additional “vibrations” – and this assumption, though attractive, is not always true. Therefore, it is worth embarking on the journey of classical vibration diagnostics by familiarizing ourselves with this broader context, i.e. other types of measurements (temperature measurement, modal analysis, stress measurement, electrical measurements, oil composition measurement, noise measurement, etc.). It often turns out that for a given object, there exists the simplest and most effective way of assessing the technical condition that fits the operating conditions.
Tasks of vibration-based systems
If we have decided to measure vibrations, the next step is to answer the question: what do we expect from the system? In the case of the general family of machine monitoring and diagnostics systems, this question corresponds to more specific tasks of the systems, which are presented in Table 1.
Table 1 Tasks of monitoring systems
| System task | Question | System characteristics |
| Fault Detection | Is there a fault? (YES/NO)ISO 20816 | Broadband indicators |
| Fault identification (mechanical component) | Which mechanical component is damaged? | Kinetostatic model + narrowband indicators |
| Fault identification (type of damage) | Type of fault (e.g., unbalance, BPFO, etc.) | Spectral analysis |
| Fault severity level(evaluation) | How severe is the fault | Trend analysis |
| Prognostics | How long can the machine operate without failure? | Alarm thresholds, modeling (point approximation) |
| RCA (Root Cause Analysis) | What is the primary cause of the fault | Advanced analysis of historical data, operating conditions + materials engineering |
| Prescription | What are the further instructions for maintenance services? | Modern modules (under development) |
The queen of damage detection is the VRMS estimate (see post #2) because the ISO 20816 standard provides specific allowable ranges of root mean square vibration velocity values depending on the machine power and a few other parameters. Identification can have multiple meanings, but vibration diagnostics, often refers to the physical details of the damage. Initially, it can indicate which part of the machine may be damaged and then what type of damage it is (e.g. tooth crack or outer race damage in a bearing – BPFO). At this point, it is important to note that the practical implementation of systems distinguishes between:
- Systems processing data without phase marker measurement (instantaneous rotational speed),
- Systems processing data with a phase marker signal, performing processing and analysis in the order domain.
Phase marker-free systems are cheaper and simpler but only enable component identification at low frequencies (due to spectral blurring). On the other hand, phase marker systems are more expensive, and more challenging to configure and install, but significantly more effective in identification.
Determining the level of significance of the damage (evaluation) usually requires recording historical diagnostic indicators, known as trends (see post #3). A classic example of this type is the increase in sideband amplitudes of gear mesh frequencies (see posts #6_1 and 6_2). Further diagnostic tasks such as prognosis, root cause analysis (RCA), and recommendations (originally prescriptions) are still under development in practice due to issues related to method parameterization, preprocessing, and selection of diagnostic features.
Types of “monitoring” systems
In engineering jargon, we often use the term “monitoring system” to refer to a “monitoring and diagnostics system.” At the same time, we talk about “diagnostic analysis” as the process of analyzing data. Interestingly, in literature, we often use the English acronym CMS, which stands for “Condition Monitoring Systems,” so the translation of the terms is not literal.
In practice, types of systems are clearly divided into protection systems, monitoring systems, and diagnostic systems. All these systems can exist independently, but they can also be combined in various hardware and application configurations. Figure 1 illustrates the mapping of vibration-based system types to the tasks of these systems described in the previous point.

Figure 1. Types of vibration-based systems mapped to tasks
As shown in Figure 1, security systems, based on defined analyses, can automatically shut down a machine. Such systems are different from the monitoring systems described in the previous posts, as they usually process relative vibrations (distance measurement, rather than vibration acceleration) and are commonly found in power plants for assessing the technical condition of turbogenerators. However, there are also vibration-based protection systems where broad-band values are typically monitored (see post #2).
Monitoring systems, in short, consist of a “trend module” and an “event module.” The trend module allows for the display of historical values of diagnostic indicators, while the event module is responsible for the process of comparing current indicator values with permissible thresholds and generating an event (email/SMS, light, sound, pictogram, etc.) if the threshold is exceeded (see post #10). As shown in Figure 1, monitoring involves detection and partial identification (full identification would require 100% effectiveness in defining narrowband analyses a priori, which is extremely difficult to achieve), as well as partial evaluation and prognosis.
Diagnostic systems, in practice, involve what we manually observe, namely diagnostic “figures” (or charts). Classic figures (signal transformations) include time waveform, spectrum, order spectrum, envelope spectrum, order domain spectrum, and time-synchronous averaging (TSA) plots. For displacement vibration signals, additional figures include orbit, shaft centerline plot, Bode plot, cascade plot, and full spectrum. Additionally, each spectrum can be averaged and scaled (applicable to amplitude types such as [g], [mm/s^2], power, RMS, and scales such as linear or logarithmic [dB]). As shown in Figure 1, diagnostic analysis involves a combination of broadband indicators, narrowband indicators, trend analysis of these indicators, as well as time and spectral analysis. The latter can include analyzing a single spectrum, comparing the current spectrum with past reference spectra (representing a healthy state), and plotting cascades of successive spectra over time. However, it is worth noting that analyzing time waveforms alone often provides answers to many questions and is invaluable for signal registration validation.
Selection of a monitoring/security system
Is a system with greater functionality always better suited for industrial applications? – Certainly not. The decision to choose the appropriate system is quite challenging as it requires answering several questions. Among the most important ones: Should the system be portable or stationary? Will rotational speed be measured? How many measurement channels will be required? What are the required sensor ranges? How long will the signals be? What frequency range is necessary? Will data be archived? What types of diagnostic figures are required? Both purchasing a system with insufficient functionality and implementing a system with excessive architecture can result in its overall low effectiveness. Therefore, the market for Condition Monitoring Systems (CMS) is quite diverse and continuously evolving. Below are a few examples of commercial systems.
Examples of monitoring systems
| The AVM 1000E module is a single-channel device that enables continuous monitoring and preliminary diagnostics of rotating machinery such as fans, pumps, compressors, etc. It features a built-in ruler (with 22 points) displaying typical warning and alarm ranges, facilitating the determination of the machine’s condition. The module provides a 4-20mA current output for the estimation signal (RMS, PEAK), allowing direct integration of the AVM 1000E into the control and monitoring system of the monitored device. Other versions in the 1000 series may include a display and relay outputs. | 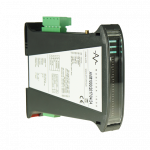 |
| The AVM 2000 series modules are available in various variants, with the most advanced one featuring resampling and tracking of the amplitude of the first and second harmonics. This allows for monitoring machines with variable rotational speeds and machines with higher power, such as steam turbines and wind turbines. | 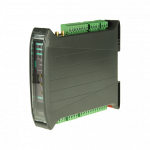 |
| The AVS 2000R series modules are wireless, dual-channel, fully configurable devices that allow for continuous monitoring and diagnostics of machines. The module enables the transmission of machine condition information via a radio network to a system where further processing takes place. Measurement data is collected cyclically according to the configured interval, and in case of communication issues, it is stored in the device’s internal memory and transmitted when the connection is established to ensure data continuity. | 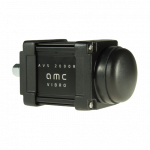 |
| AVM 4000 is a modular, multi-channel, and autonomous system designed to operate alongside machinery. Through signal conditioning, high-quality data acquisition of signals and process parameters, and continuous analysis, the system monitors the condition and safeguards the operation of machines. With the True Data ValidatorTM technology, real-time data verification, automatic detection of machine states, and advanced diagnostic analysis, the system effectively identifies anomalies in the early stages of development and significantly reduces the number of false alarms. | 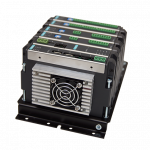 |
| MEGGIT VM600 (MK2) is a modular protection system designed for continuous monitoring of generators in typical coal-fired power plants. Systems of this kind not only protect the generator but also other equipment, making them practically indispensable for 24/7 productivity. | 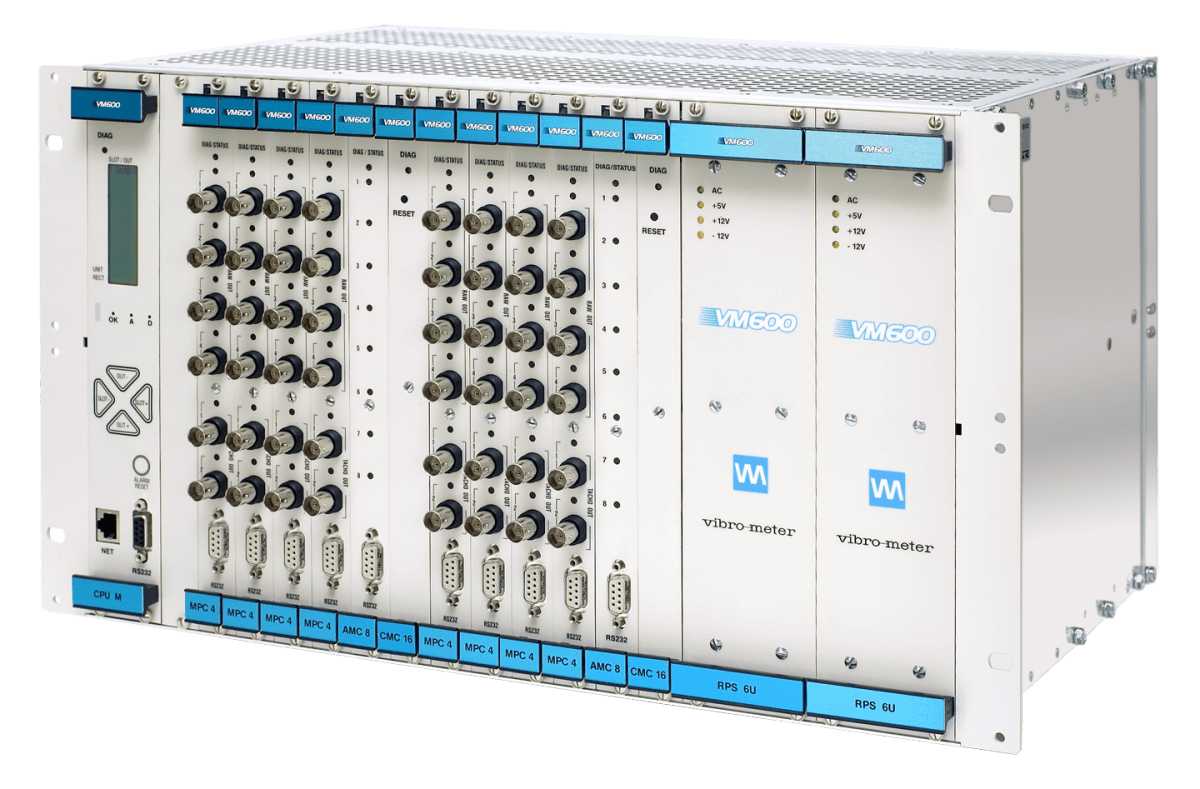 |
Book recommendation