products for monitoring and diagnostics of machinery
A(M)Cademy of VIBROdiagnostics
#10 Alarm thresholds
Why set thresholds?
The purpose of the diagnostic system is not only to measure vibrations but also to process and analyze them. In most cases, operators have plenty of other tasks and simply don’t have time to analyze charts (more or less user-friendly, depending on the system manufacturer). Virtually every system allows for setting and detecting threshold values. This way, monitoring of the dynamic state can be highly automated. Often, it is possible to connect threshold crossing activation with binary output action, enabling a fully automatic response, such as machine shutdown. This is the basic functionality of security systems.
Of course, in order for this to happen, the threshold needs to be activated and its value set. It may seem like an obvious statement, but quite often, one encounters operational systems where only a small percentage of alarm thresholds are set. The authors have come across such “under-configured” systems in very serious facilities across various industries and countries (and these systems were manufactured by different vendors). This situation is usually explained by a lack of time because, in reality, setting meaningful alarm threshold values requires understanding the problem and a considerable amount of time. Let’s describe this process step by step.
Why is setting thresholds difficult?
Firstly, the concept of “threshold” can apply to different types of data due to their varying formats. When thresholds pertain to trends (i.e., 1-dimensional time series), they are expressed as single values. When comparing spectra, the threshold takes the form of a mask (a series of points connected by lines). When analyzing images, the threshold is typically represented as a matrix. Additionally, thresholds are set differently for signals from accelerometers compared to signals from position sensors, and so on. Figure 1 illustrates several exemplary formats of thresholds in CMS systems conceptually.
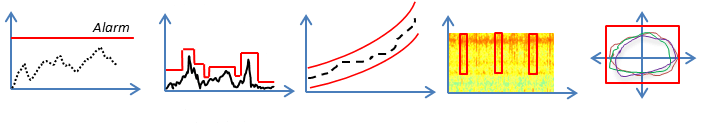
Fig. 1 Different types of alarm thresholds
Since the post is about basic technical diagnostics of rotating machinery using accelerometers, we will focus on the most commonly encountered class – thresholds for trends in the format of single numbers (or, as a mathematician would say, scalar values). Secondly, thresholds can be set “top-down” (i.e., based on norm values) or can be set based on data. Setting thresholds based on norms is relatively straightforward, but unfortunately, for the remaining thresholds (and there are many of them), it is a bit more challenging. This is because it is never entirely clear what the relationship is between the values of trend points, the trend itself, the threshold value, and the machine’s technical condition. Fig. 2 illustrates two general types of thresholds.

Fig. 2 Two categories of threshold settings – ISO norm thresholds and relative thresholds
The list of indicators for which norms provide specific threshold values is very short. For most machines, the dominant indicator is the permissible effective value of vibration velocity signal Vrms in a defined frequency range, symbolically presented in Fig. 2 and discussed in Post No. 2. In the following part of the post, we will present an example of setting a much larger group of thresholds, namely relative thresholds.
Why can setting thresholds sometimes be even more difficult?
In machine monitoring and diagnostic systems, it is common to deal with different levels of thresholds, such as the warning threshold (often labelled as “Warning”) and the alarm threshold (often labelled as “Alarm”). If a threshold is exceeded, the system (and theoretically the machine) is in the respective Warning or Alarm state. Additionally, it has been recognized that the time windows for entering and exiting these states are significant, and thus hysteresis has been introduced. Figure 3 illustrates two cases of threshold definitions. The upper graph illustrates the defined Warning and Alarm thresholds and their corresponding time state intervals. The lower graph illustrates the system’s behaviour for the same levels but with an additional hysteresis value defined for the Alarm threshold. Depending on the system, hysteresis can be defined by a combination of time interval (or number of points) and trend value.
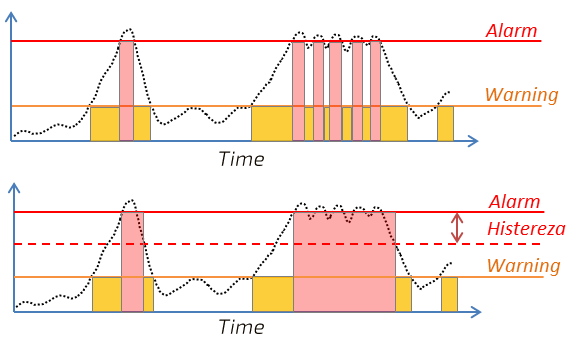
Fig. 3 Comparison of a threshold with hysteresis and a threshold without hysteresis for the Alarm state
As seen in Figure 3, the idea of hysteresis is to prevent the system from generating “unnecessary” alarms in case of oscillations around the threshold value. There is another type of hysteresis (also known as a “counter”), which determines how many consecutive trend points must exceed the threshold for it to activate. The purpose of introducing counters is to avoid random alarms. Unfortunately, in practical data analysis, every type of hysteresis can lead to a flawed visual interpretation of the data because whenever hysteresis is used, the operator needs to be aware of its parameters and view the data in the appropriate historical context, which means considering a time range that can explain the current system state.
Finally, let’s not forget that even in systems without alarm thresholds, where observational data analysis is performed, vibration data is often, to put it mildly, “unstable.” This is mainly because in industrial situations, where machines are not isolated from each other and operate in their typical environment, they are constantly subjected to varying loads (more or less frequent and intense), which modify the vibration signals. As a result, there is almost always a certain degree of measurement uncertainty, which means there is a chance of misinterpreting the data. These errors can result in missed alarm states as well as false alarms.
False alarms
In engineering jargon, we commonly refer to “false alarms” and “ineffective systems,” meaning damages overlooked by the system. In the academic world, the terms “false positive alarms” and “false negative alarms” are used instead. The former refers to situations where the system reports damage that did not occur, while the latter refers to cases where the system fails to detect actual damage. To answer the question of why the industrial language focuses on “false alarms” (referred to as the False Alarm Rate or FAR), we need to consider which scenario is worse – a false alarm or a missed alarm.
Although intuitively we might think that a missed alarm is worse, let’s imagine a scenario where a bearing failure occurs, causing three different indicators to increase to varying degrees. If one indicator misses the damage, the other two will detect it, so the missed detection is not a problem. However, if the bearing is in good condition, but the system shows a daily alarm due to an improperly set threshold, the operator will take action (which is always costly) and then simply ignore the system’s information. Because false alarms significantly hinder the use of CMS systems, there is a strong need to minimize the False Alarm Rate (FAR).
We set the threshold step by step
Thresholds are typically set by humans based on experience and analysis of historical data. Each experienced diagnostician may have their own method, but here we want to present the most commonly used approach to determining threshold values.
As a reminder, we are dealing with setting thresholds in scalar form (one Warning value and one Alarm value) for individual trends. Therefore, the input to the algorithm is a trend (one-dimensional series of data) and threshold setting parameters, and the output consists of two numbers, as shown in Figure 4.
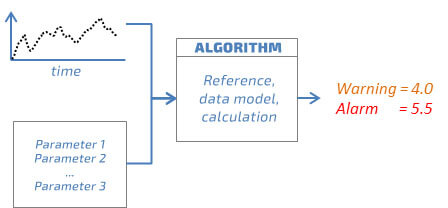
Fig. 4 Input and output of the scalar alarm threshold calculation scheme
According to the accepted practice (outlined in VDI 2056, ISO 2372, and ISO 10816 standards), an increase in vibration amplitude in the range of 6-8dB (corresponding to 2-2.5 times) can be considered as the Warning level, while an increase of 20dB (corresponding to 10 times) is considered the Alarm level. The question is, how do we calculate this increase when we have the “entire trend”? Let’s answer step by step.
- Step 1 – Preprocessing
Sometimes it happens that every point in the trend is important and correctly recorded, so in the first step, we need to remove any points that may negatively affect the calculations. The most commonly used methods are operational state filters (e.g., velocity/power within a specified range) and the removal of outliers, which are values that are too large or too small to be true. Figure 5 illustrates an example of such filtering.
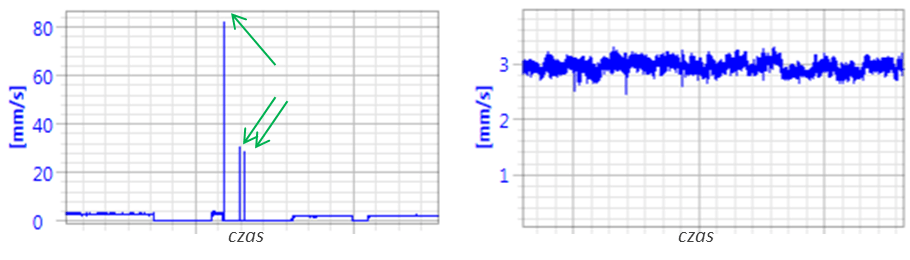
Fig. 5 Filtering outliers
- Step 2 – Data Modeling
When calculating alarm thresholds, we are always using some form of data model, even if we are not aware of it. For example, in a typical approach (which can be found in many books), if someone sets the warning threshold as 3 standard deviations from the mean value, they are implicitly assuming a Gaussian model, which may not be accurate without verifying if the data actually follows this distribution. There are other models as well, such as smoothing trends using techniques like decimation or low-pass filtering (LP). Another group of models falls under the category of “process parameter identification” and involves explicitly modelling the parameters of the process. Figure 6 illustrates a simple modelling example using an LP filter.
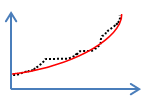
Fig. 6 Trend modelling
- Step 3 – Determining the Reference Level
Having the trend model, which is a mathematical formula describing the trend in a certain way, we can adopt an indicator (another mathematical recipe) to determine the reference value. For bidirectional trends (such as temperature), the reference value can be, for example, the mean or median value. However, for vibration signal trends, these values are not recommended due to the typically asymmetric distribution of vibration data. It is important to note that it is best to calculate the reference value using data related to the healthy state of the machine.
- Step 4 – Determining the Warning Level
Once the reference value has been determined, the final step is straightforward. The warning level can be obtained by appropriately increasing the reference value to the warning threshold.
Variable Operating Conditions
When a machine operates under highly variable operating conditions (e.g., a wind turbine), for easier setting of alarm thresholds, the data is pre-classified into “operating states.” Each state describes ranges of key process parameters, which typically include speed and load (depending on the machine, it can be in the form of power, torque, or current consumption). Figure 7 illustrates process signals and vibration level (RMS value) from a machine operating in the following conditions:
- Low speed and small load
- Low speed and high load (slight decrease in vibrations)
- High speed and small load (significant increase in vibrations)
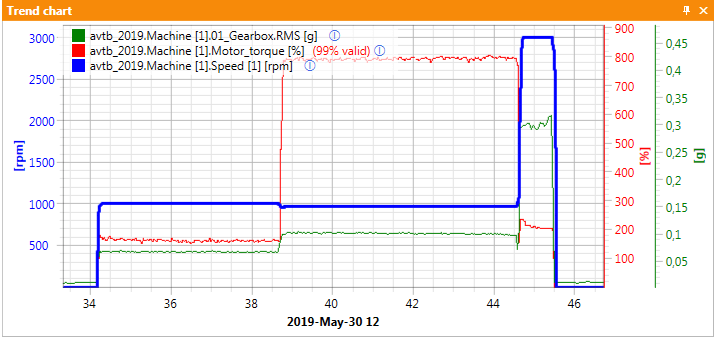
Fig. 7 Process parameters and RMS vibration value of a machine operating under variable operating conditions
For example, for this machine, it would be necessary to set the Low operating condition for speeds around 1000 rpm and the High operating condition for speeds around 3000 rpm, as the vibration level ratio between the two conditions is 1:3. Consequently, in each condition, the trends should be analyzed independently.
Automatic threshold setting
As mentioned before, threshold setting is a crucial and necessary task for effectively utilizing the information provided by the CMS system. On the other hand, it requires experience and often a significant amount of time. To simplify this process, the VIBnavigator® tool includes a module for automatic threshold setting based on mathematical trend modelling, represented by the icon in Figure 8.
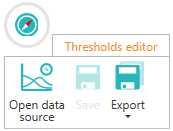
Fig. 8 Data source selection button for the Automatic Threshold Calculation (ATC) module in the VIBnavigator environment
Next, a window will appear where you need to select several parameters. First, in the channel tree, you should choose the trends for which you want to set alarm thresholds, as shown in Figure 9.
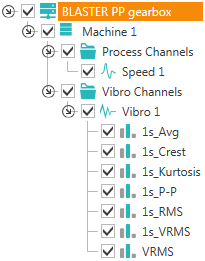
Fig. 9 – Selection of trends for the ATC module in the VIBnavigator environment
After selecting the channels, you can set the preprocessing data parameters and modify the default parameters of the mathematical trend model to accurately calculate the reference value for highly unusual machines, as illustrated in Figure 10.
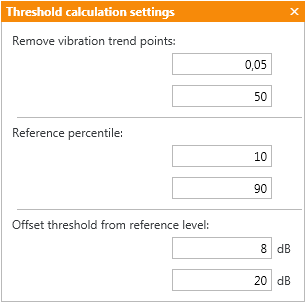
Fig. 10 Selection of parameters for the ATC module in the VIBnavigator environment
After selecting the channels and settings, the system will display a summary window for user verification, as shown in Figure 11.
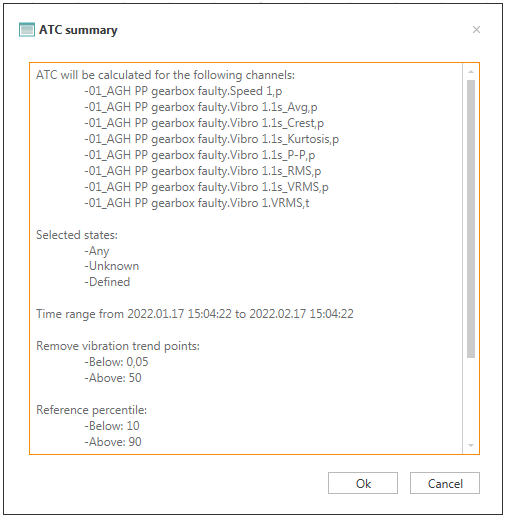
Fig. 11 Verification window of the ATC module in the VIBnavigator environment
Upon selecting OK, the system automatically calculates the thresholds and generates a new, updated system configuration. Figure 12 presents an example data series with set warning and alarm thresholds.
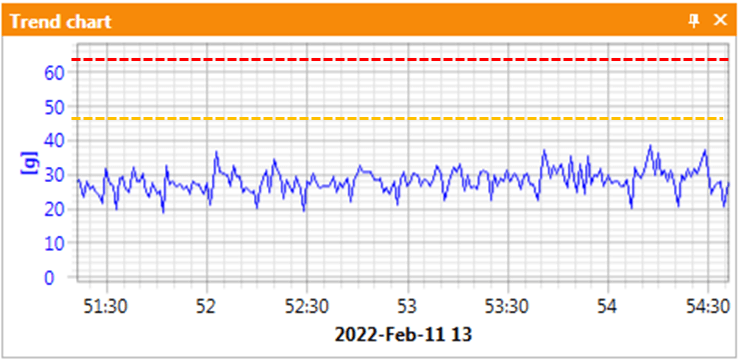
Fig. 12 Warning and Alarm thresholds set by the ATC module in the VIBnavigator environment
Of course, there may be situations where automatic threshold calculation may not be accurate, often due to various data quality issues. In such cases, the user is informed about the problem and can make a decision regarding the threshold values.
Application of measurement equipment
AMC VIBRO offers systems that have the functionality to automatically set alarm thresholds in all required operating states. This allows for saving even dozens of hours of diagnostic work. Above all, it enables the full utilization of the potential of machine monitoring and diagnostic systems.
Table 1 Comparison of AVM device family in terms of alarm threshold setting
| AVM 2000 | AVM 4000 | |
| PP thresholds, RMS thresholds, VRMS thresholds | ✔️ (selected models) | ✔️ |
| Thresholds for narrowband analysis | ✔️ (selected models) | ✔️ |
| Thresholds for synchronous analysis | ✔️ (selected models) | ✔️ |
| Thresholds for narrowband analysis calculated based on the kinematics diagram | ✔️ | |
| TSA analysis thresholds | ✔️ | |
| Automatic alarm threshold setting module | ✔️ |
Book recommendation