products for monitoring and diagnostics of machinery
A(M)Cademy of VIBROdiagnostics
#2 What is RMS and what is it calculated for?
In vibration analysis there often appear descriptions indicating what value of vibrations is being measured, e.g. PP, ZP, RMS, VRMS, EnvRMS, EnvPP. It is very important in practice, for depending on the type of measurement, the same vibrations will be described with different values. It is worth knowing what distinguishes different values and how to compare them.
First, however, it is worth asking: why use such descriptive values anyway, since we already measure vibrations?
The reason is the fact that vibration measurement is a measurement of a dynamic quantity, which constantly changes. As a result, it is different from a measurement of static quantities like temperature. If measuring the temperature for 1s, the result will be one numeric value, for example, 45.8 °C. In case of measuring vibrations throughout 1s, the device will take as many measurements as the value of the sampling frequency, which may reach over a dozen kHz. Thus, for the 25 kHz frequency, our device will measure 25 thousand numbers. There is no use showing all of those values on the display – the user expects one value, which will show them how “big” the vibrations are. There are several of those methods and today we will describe the most popular one.
In our first post, we described several physical quantities: acceleration, velocity and displacement of mechanical vibrations. For each value, we can give the amplitude of vibrations. It will be either the difference between the lowest and the highest temporary level of vibration (so-called “Peak-Peak” PP amplitude) or half of that value (so called “Zero-Peak” ZP amplitude). Amplitude, however, is not the most popular measure of vibration. The value described as “RMS” is used way more frequently and will be discussed today.
Although technically RMS indicator has a very precise definition related to the statistical description of periodic signals (especially in the analysis of electrical signals), in practical analysis of vibration signals one can say that it is the most popular numeric value describing average “vibration level” of a certain machine. An electrical or electronics engineer will call it an “effective value” of a signal.
How to calculate RMS?
The meaning of the RMS indicator is described in its name, i.e. Root Mean Square. The Root element indicates calculating (in the last step) a square root, the second element Mean indicates mean value and the third Square, that each value of the signal is squared, as shown in Picture 1.
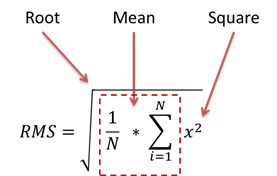
Picture 1. Calculating the effective value – RMS
As shown in Picture 1, the sequence of operation is inverted relative to consecutive letters in the RMS abbreviation i.e. when calculating the RMS value of a digital signal, first, we square all values (Square), then calculate the mean value (Mean) sum up successive values and divide by their quantity and lastly calculate the square root of that value (Root).
Why is the RMS of the signal confused with its energy?
It is very common that in industrial jargon, RMS and the concept of signal “energy” are used interchangeably – which does not pose any problems for practicians, however, can lead to differences in signal processing paths (e.g. comparing values from two distinct systems). In table 1 the RMS has been juxtaposed with crucial cognate concepts – power and energy of a signal.
Table 1 the juxtaposition of indicators
| Name of the indicator | Calculation method | Relationship |
| Signal energy | E=∑▒x^2 | sum of squares |
| Signal power | P=1/N*∑▒x^2 | normalized Energy |
| Signal RMS | RMS=√(1/N*∑▒x^2 ) | square root of Power |
Where N – number of points in a digital signal
RMS of sinusoidal components
As shown in Table 1, the Energy of a periodic signal (or more broadly stationary) rises proportionally to its length (time T for analog signals or sample size N for digital signals) therefore it is not suitable to evaluate technical condition, since all it takes is to shorten the signal, to achieve a value that is “compliant with the norm”1. In many cases tracking the Power of a signal would describe the condition of a machine quite well, however, it is worth noting that “the farther” the peak values of a signal are from the value 1, the harder it becomes to write (thereby interpret) the result of Power. In turn, the RMS quite easily estimates the value of vibration level regardless of the amplitude value, as shown in Picture 21. The square of the signal value in Energy, Power and RMS formulas is crucial not only due to the negative values of the signals but also because of the possibility of analogical calculations in the frequency domain (see Parseval’s theorem or Plancherel’s theorem).

Picture 2. Values of Energy, Power and RMS of a signal for 1, 0.5, 5 levels of Zero-Peak amplitudes
Harmonic signal and real-valued signal
In the previous section, one demonstrated that RMS is a good indicator for describing the vibration level, regardless of the signal values. Now we will show how the RMS behaves for different types of signals, respectively for a signal consisting of harmonic components and two examples of real-valued signals – one from an unbalanced rotor machine and the second from a piston compressor with a damaged bearing.
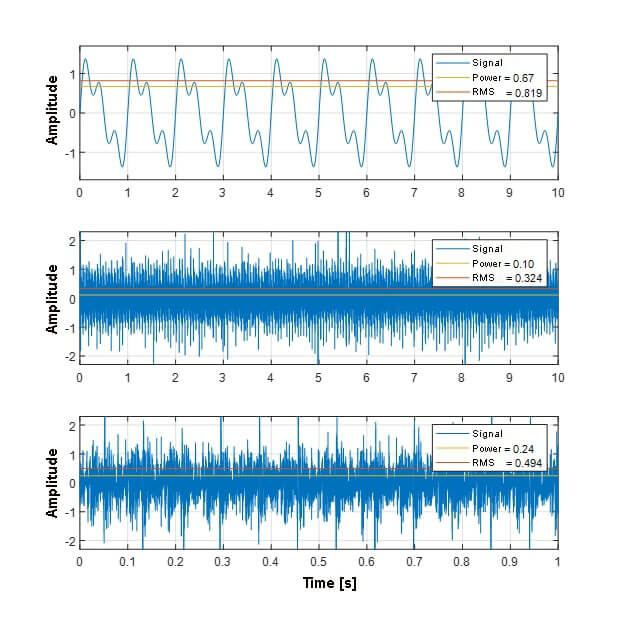
Picture 3. RMS for different types of signals: signal consisted of harmonic components, signal from an unbalanced rotor machine, signal from a piston compressor with a damaged bearing.
Comparing the lower plot in Picture 2 with plots of real-valued signals in Picture 3 one can easily notice that relatively small changes in signal power level are related not only to its peak value but also to its character, that is its spectral distribution, while RMS values are more predictable in any type of periodic signal, which indicates that RMS is the most convenient indicator in use.
RMS in practical evaluation of the technical condition
As part of the technical condition assessment based on the vibration level, the RMS indicator is used in several ways, mainly as:
- RMS of a velocity signal (Velocity RMS – abbreviated to “VRMS”) compliant with vibration norms
- RMS of an acceleration signal
- RMS of the envelope of an acceleration signal
- RMS of a velocity or acceleration signal in a user-defined band
According to vibration norms (VDI 3834, ISO 10816, ISO 20816), acceptable vibration values of machines are mainly specified for the RMS value of vibration velocity signal for two reasons. First of all, historically, the first measurements of rotating machines were taken using electrodynamic vibration velocity sensors, for which one had amassed a number of data and long experience. Secondly, vibration velocity most faithfully represents dangerous forces acting on a machine in the widest frequency band (see Post #1 – Acceleration, velocity and displacement of vibrations). According to the electrical power of a machine, its nominal rotation speed and type of foundation, the acceptable value of VRMS resides within the general range of 4.5 – 28 mm/s.

Picture 4. The „Mimic screen”-type view of an industrial installation in AVM 4000 system
Picture 4 depicts an exemplary use of VRMS indicator in order to detect unacceptable vibration levels of an industrial pump. Values marked in grey are safe, values marked with yellow indicate the beginning of damage and the ones marked with red inform that the machine should immediately be put away and repaired. In modern data explorers, such as VIBnavigator, clicking on a colored area of an indicator will pop up a historical plot for further analysis, similar to the one shown in Picture 5.
Attention! The possibility of referencing the value of the VRMS indicator directly to an acceptable value from a norm makes this indicator a priority over other indicators.
Attention! There exist a second set of norms describing measurements with the use of eddy-current vibration displacement sensors (eddy-current sensors, proximitors), which are not discussed today. They are considerably more expensive and are mainly used in huge machines with plain bearings (e.g. energy turbosets).
RMS of an acceleration signal is another prevalent diagnostic indicator. Although unlike the VRMS it does not provide an unequivocal assessment of technical condition, it is generally more effective in detecting early symptoms of the damage, especially important damages to rolling bearings and toothed gears. Unfortunately due to a strong relationship between the RMS level and noise level, the character of machine work and specific measurement equipment, the RMS of an acceleration signal does not have generally accepted threshold values, therefore is a relative indicator.
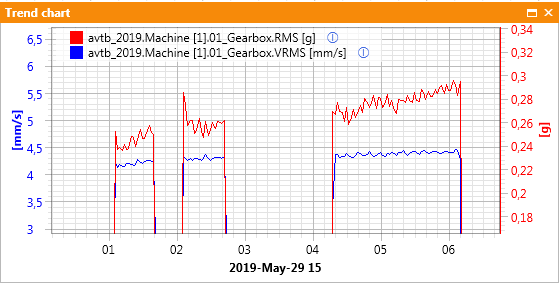
Picture 5. An exemplary plot of RMS and VRMS indicators of developing damages of a machine
One should remember that within the detection of deterioration in the early stage of development, the VRMS indicator is especially effective in detecting damages manifesting with generating components in low frequencies (usually within the range of 2Hz-500Hz), thus mainly drive shafts. In case of early-stage damages to machine components generating vibrations in higher frequencies, RMS indicators of an acceleration signal are in general more effective, as shown in the case of gear vibrations in Picture 5.
RMS of the envelope of the acceleration signal is used in the early detection of machine structural vibration changes (increases). Because of that, it is invaluable in the early detection of rolling bearing damages, especially in the case of unknown geometric data (i.e. when one can not precisely identify the type of used bearings nor determine their characteristic frequencies).
RMS of a defined band is an indicator that allows us to track chosen spectral component which corresponds with a specific shaft, gear, shoulder blades(e.g. particular grade of a turbine) or a specific part of a rolling bearing( inner or outer ring, rolling element, cage). Within monitoring of shafts and gears of various types, one uses wideband analysis acceleration and velocity signal the most frequently, and within rolling bearings monitoring the narrowband analysis of acceleration, the signal is used exclusively.
Use of measuring equipment
AMC VIBRO company offers the RMS indicator measurement using modern AVM1000, AVM2000 and AVM4000 series devices. AVM1000 series is a 1-channel easy-to-use system allowing the user to measure the RMS indicator of an acceleration and velocity signal. AVM2000 series additionally enables us to analyze the envelope signal of an acceleration signal and determine power in designated frequency bands both for an acceleration signal and velocity signal. AVM4000 product allows us to calculate the RMS indicator, power and any others from any chosen physical quantity of a signal, i.e. vibration acceleration, velocity as well as displacement in any defined band. The above was juxtaposed in table 2.
| AVM 1000 | AVM 2000 | AVM 4000 | |
| RMS acceleration | ✔️ | ✔️ | ✔️ |
| RMS velocity | ✔️ | ✔️ | ✔️ |
| RMS displacement | ✔️ | ||
| RMS envelope of acceleration signal | ✔️ | ✔️ | |
| Power2 of acceleration signal band | ✔️ | ✔️ | |
| Power3 of velocity signal band | ✔️ | ✔️ | |
| Power of displacement signal band | ✔️ | ||
| RMS of acceleration signal band | ✔️ | ||
| RMS of velocity signal band | ✔️ | ||
| RMS of displacement signal band | ✔️ |
1 The square of the signal value in Energy, Power and RMS signal formulas is important not only due to the negative values of signals but also because of the possibility of analogical calculations in the frequency domain( see Parseval’s theorem or Plancherel’s theorem).
2 There exists a possibility to change the Power calculations to RMS
3 There exists a possibility to change the Power calculations to RMS
Book recommendation