products for monitoring and diagnostics of machinery
A(M)Cademy of VIBROdiagnostics
#6_1 Gear vibration diagnostics – basics
Not just in cars
The first transmissions were manufactured in the year 1940. This statement would be true if we were talking about automatic transmissions and mass-produced ones. In general, transmission technology development is an issue of mechanics, anthropology, and biology[1]. Nevertheless, before recognizing that the diagnosed transmission is complicated, it is worth taking a look at the history of the Antikythera[2] mechanism.
Toothed gears, which will be addressed today, are first and foremost the result of inventing high-speed electric engines, precise machining processes, high-performance materials and defining tribology, as the study directly related to the exploitation costs of gears, by Peter Jost in 1966 [3,4].

Picture 1. Multi-stage helical gear.
Picture 1 depicts an exemplary transmission from a printing machine (quite hard to diagnose, which we will come back to later). The world of toothed gears is surprising due to their diversity (counting all types and variants of transmission as well as types of toothed gear would take a lot of lines), and at the same time the simplicity of their purpose – transmission is always used to change speed/torque and sometimes change the direction of rotation.
More about the terminology of toothed gear can be found in the next post.
From physical transmission to GMF on the spectrum
Picture 2 shows the process of generating characteristic frequency for a 1-stage parallel gear. In this case shaft “IN” is the drive shaft of the whole system, so its gear ratio is 1. In the first step, we create a list of variables and unknowns. The smaller gear with Z1 = 23 teeth is mounted on the IN shaft, while the bigger gear with Z2 = 67 teeth is mounted on the OUT shaft. In the next, in practice the most difficult step by far, we formulate equations, which will connect the number of teeth and the gear configuration with input and output. Generally, there are two types of variables: ratio (which is the proportion between input and output) and characteristic frequency – here the GMF (Gear Meshing Frequency).
Picture 2. Scheme of generating characteristic frequencies of transmission.
For simple examples, such as ours, gear meshing frequency is equal to the product of the rotational speed of the shaft and the number of teeth, which is:
GMF = V1*Z1 albo V2*Z2 = 1*23 albo 23/67*67 = 23
Despite the fact that this post references characteristic frequencies, presented calculations are done in order domain. In order to operate on Hertz, all values must be multiplied by the average rotational speed in [Hz]. For example for GMF = 23 (ord) and machine speed of 50 Hz, GMF = 23*50 Hz = 1150 Hz. The above formula also indicates that the more teeth on the gear the slower the shaft rotates, and vice-versa. Our formula is quite simple, however in the case of multi-stage systems, especially for planetary gears, formulating correct equations is way more complicated.
More about the terminology of toothed gear can be found in the next post.
Afterwards, for every characteristic frequency (not for the ratios), the band range is defined, because the monitored band, as the representation of a mechanical element, is virtually always represented by more than one spectral line. One of the most popular methods of defining bandwidth is assuming BW (bandwidth) is equal to 3% so +/- 1.5% from theoretical values. Picture 4 in the last step illustrates the transformation of the analytical value of GMF=23 into two values defining spectral range from 22.9 to 23.1. Ratio OUT is written down in the most precise form and can be used as input IN for the next gear.
In modern monitoring and diagnostics systems, analytical calculations can be done automatically as a part of system configuration.
.")
Picture 3. Exemplary scheme of the drive system and automatically calculated characteristic frequencies (AVM 4000 system).
Picture 3 shows a VIBnavigator system module, which calculates a set of characteristic frequencies based on parameters of a drive system model, made of ready-made elements.
Types of gear damage
In practice, everything in toothed gear can be damaged. However, it is customary to distinguish damage such as a cracked tooth at the base, chipping off a part of a tooth (local damage) and very common pitting and spalling which can be both local and scattered. Precise classification of gear damage is very wide and is not limited to the source of damage (e.g. incorrect assembly vs. fatigue damage or typical exploitation wear), but also considers the advancement level of damage. A good overview of the damage characteristic with pictures can be found in[5], and a practical description of the cause in[6].
Gear vibrodiagnostics
The foundation of gear technical diagnostics is a spectral analysis of its meshing components (GMF) and sidebands (SB). An exemplary gear spectrum was shown in Picture 4, which takes into account the so-called sideband cursor. The presented spectrum involves data shown in Picture 2. Marked order 23 represents gear meshing (GMFx1), and four marked sidebands refer to the free shaft (OUT), which ratio is 26/67 (approximately 0.34). Spectral analysis in picture 4 consists of defining clear frequency GMFx1 and clear first and third double sidebands (DSB) from the free shaft (order 0.34) at the third of the GMFx1 component level. In a typical situation, said components would be monitored further.

Picture 4. Spectrum with proximity to the GMFx1 gear frequency
Although the literature and the internet offer numerous materials concerning interpreting gear components, the experience of the authors shows that in general using the same interpretational rules for different types of gear (especially for gears working under different conditions) is not a proper approach. Why is that?
More information about nonlinearity and mesh stiffness function, which are the key to answering the question, can be found in the next post.
How to practically evaluate transmissions based on the vibration signal?
There are 3 general approaches that can be taken: constant monitoring of predefined components, periodic diagnostic analysis with the help of classical methods and using innovative methods. In the first case, the lower the gear meshing frequency (preferably below 500 Hz), the higher the probability, that the wideband indicators, such as VRMS, will be sensitive to the increase in any components generated by the transmission. In the case of systems which provide us with tracking narrowband components, it is advised to track e.g. first four harmonics GMF and the first two pairs of sidebands from each shaft for each GMF. However, one should not expect that damage will generate an increase in all of those components. Picture 5 illustrates the definition of exemplary narrowband components.

Picture 5. Exemplary gear components in the monitoring process. The IN symbol indicates the fast shaft, and the symbol OUT indicates the slow shaft, according to picture 2. Letters L/R indicate Left/Right respectively.
Summing up, if a gear of a certain type works with constant operating parameters, one can point out a general pattern of damage development, which is shown in Picture 6.
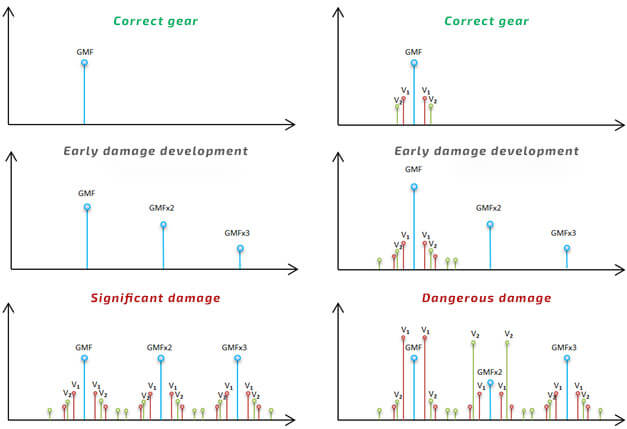
Picture 6. Generic spectral pattern of gear damage development. The symbols V1 and V2 refer to the speed of the shafts. The left and the right column show exemplary data from different gear in the same technical condition and the difference between them is usually related to damage. As you can see it is crucial to track the development of spectral components.
In the second case, with the means and time to analyze a specific transmission, we can use other classical tools besides trends, in particular comparing spectra and using envelope analysis.
About innovative methods, although they were created and there have been hundreds of publications, they are usually characterized by parametrization or the need to possess specialistic knowledge enabling us to interpret various graphs, which is why it is hard to prove, that any innovative method has replaced classical methods. Nevertheless, curious readers may reach for a comprehensive report from 2012, which compares the effectiveness of numerous methods[7].
More information about advanced methods of technical gear diagnosis as well as the main problems related to it can be found in the next post.
Sideband cursor
As shown in Picture 4 various cursors are used in diagnostic gear analysis, e.g. sideband cursor. In this post, we used the harmonic cursor available in the VIBnavigator environment.
Pictures 7 and 8 show an exemplary use of the sideband cursor in vibrodiagnostic gear analysis.

Picture 7. Gear vibration spectrum – two cursors.
In Picture 7 there are two independent sideband cursors for GMFx1 and GMFx2. The ability to work with multiple cursors is invaluable in the case of multi-stage gear spectrum analysis.

Picture 8. Gear vibration spectrum – single cursor.
Picture 8 depicts a different analysis, in which the intuitive possibility of adding subsequent sidebands in the sideband cursor for selected meshing frequency was used. Both functionalities mentioned above are available in the VIBnavigator environment.
Use of measuring equipment
The AMC VIBRO company offers detection, identification as well as evaluation of gear technical state using various measuring techniques and analysis. In particular, the VIBnavigator program allows us to calculate characteristic frequencies even for complicated drive systems.
Table 1 The juxtaposition of AVM family devices used in monitoring and gear diagnostics.
|
|
|
|
|
| Detection and identification of GMF harmonics and sidebands SB in frequency domain determined manually | ✔️ | ✔️ | |
| Detection and identification of GMF harmonics and sidebands SB in order domain determined manually | ✔️ | ✔️ | |
| Detection and identification of GMF harmonics and sidebands SB in frequency domain determined automatically | ✔️ | ||
| Detection and identification of GMF harmonics and sidebands SB in order domain determined automatically | ✔️ | ||
| Structure of a kinematic chain model | ✔️ | ||
| Comparing spectra | ✔️ | ✔️ | |
| Envelope analysis | ✔️ | ||
| Advanced user’s analysis | ✔️ | ||
| Visualization of 3D damage development | ✔️ | ||
| Sideband cursor | ✔️ | ✔️ |


References
[1] https://www.nationalgeographic.com/science/article/this-insect-has-gears-in-its-legs
[2] https://pl.wikipedia.org/wiki/Mechanizm_z_Antykithiry
[3] https://en.wikipedia.org/wiki/Peter_Jost
[4] https://pl.wikipedia.org/wiki/Tribologia
[5] FAILURE ANALYSISGEARS-SHAFTS-BEARINGS-SEALS, Rexnord Industries, LLC, Gear Group, 1978
[6] http://www.motoreduktory.eu/analiza-zazebienia/192-uszkodzenia-kol-zebatych-przekladni.html
[7] https://www.nrel.gov/docs/fy12osti/54530.pdf
Book recommendation