products for monitoring and diagnostics of machinery
A(M)Cademy of VIBROdiagnostics
#5 What is misalignment and what does it have to do with “harmonics”?
Alongside unbalance, misalignment is one of the most frequent damage states in typical rotor machines. As the name suggests, misalignment occurs whenever two rotating shafts (connected with a coupling) do not lie on the same axis. Since misalignment usually generates so-called “harmonic components”, this term will be explained in the post as well.
Types of misalignment
Similarly to unbalance, it should be noted that the problem of “misalignment” may be looked into from two different perspectives:
- In the case of analysing work of shafts mounted on machines with considerable power ( usually energy machines), misalignment of the shafts’ lines is a complicated dynamic phenomenon, connected to i.e. displacement of bearing supports and so-called non-parallelism of bearing shells in regard to the axis of bearing journals. This analysis involves measuring relative vibration, based on which one produces various types of images of the vibration of bearing nodes, natural vibrations, shaft trajectories, etc.
- In the case of analysing drive systems of the largest group of rotor machines in the industry ( included in the ISO 20816 norm) which will be the focus of the article, misalignment concerns the situation where two shafts connected with a coupling do not work in the same axis. In those machines, one distinguishes two types of misalignment: parallel misalignment – where the axis of the shafts are different and angular misalignment – where the axis is at an angle to each other, which was shown in Picture 1. In addition, when angular misalignment occurs on different planes, this fact can be noted by naming that misalignment “spatial”.
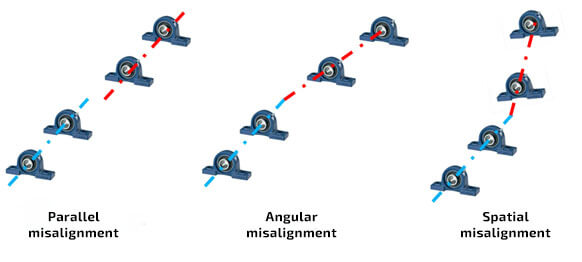
Picture 1. Types of misalignment in typical rotor machines
Terminology
Typically the literature states that misalignment generates the so-called component “2x”. This statement is generally correct, however, it is not always the case. Before justifying our doubts, let us start by explaining what that abbreviation means. The “2x” symbol refers to the frequency twice as high as the reference frequency. In machine diagnostics, the reference frequency is (nearly always) the frequency of the drive shaft, which is marked as “Shaft 1x” or in short “1x”. In that case, “1x” also represents the speed of a rotor machine (in Hz, after multiplying by 60 – in RPM). It is worth noting, that some people refer to 1x as fundamental frequency, and some as “first harmonic”, which is why the component in question “2x” is often called “second harmonic”, implicitly “of the drive shaft”.
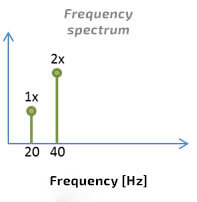
Picture 2. Component „1x” and component „2x” in the frequency domain
Picture 2 schematically shows the frequency spectrum with the 1x component, corresponding to the speed of a rotor machine equal to 20 Hz and with the 2x component, corresponding to the frequency of 2*20 = 40 Hz (40*60 RPM = 2400 RPM).
A little bit more about harmonics
For a moment, the reader will be brought to the world of the theory of signal computing (no worries, there will be no formulas). Let us bring back three facts:
- According to Fourier’s analysis, all real-time signals can be represented by a set of sinusoidal components (in other words: one can calculate the spectrum of any vibration signal),
- A single sinusoidal component in the time domain is represented as a single component (so-called spectral “stripe”) in the frequency domain,
- According to theory an “ideal” pulse in the time domain (i.e. one that is infinitely narrow and immediately reaches infinity – so-called “Dirac delta function”) is represented as a horizontal line in the frequency domain. Even without a precise mathematical apparatus, based on the facts stated above, using visual analysis “backwards”, one can deduce that the signal whose spectrum consists of two or more sinusoidal components in the time domain, is represented in the (original) time domain by an appropriate amount of sinusoidal components which was schematically shown in Picture 3.

Picture 3. Ideological representation of signals in the time domain and in the frequency domain, from the top: sinusoidal component, pulse and two sinusoidal components
In practical signal analysis Picture 3 brings about 2 main conclusions:
- The closer the analyzed signal is to a perfect sine, the more similar its spectral representation is to a single component (i.e. “stripe”),’
- If the time signal is “far” from a perfect sine in a repeating way, the stripes on the spectrum will be seen equally apart – harmonically.
Given that harmonic components in the diagnostic signal analysis are connected to an imperfect sinusoidal motion, their presence (especially growth), is a very crucial symptom of damage development.
Now, let us come back to the topic of misalignment.
Detecting misalignment
As mentioned before it is typically stated that misalignment is detected by tracking the second harmonic of the 2x shaft – but why? A good analogy will be a cyclist that rides in front of us with an uneven wheel, like in Picture 4.

Picture 4. Analogy to misalignment of a rotor machine
In the simple example, it is easy to notice that the wheel makes two motions on a plane in front of us, because during the first one it “leaves” its place, and during the second “returns” to its place – and it is obvious that the situation must repeat once every rotation. Thus, the frequency of “vibration” is twice as high as the frequency of the rotations. The situation is analogical with machine shafts – each move that takes it from a theoretical common axis must be compensated during every rotation.
In practice, however, the manifestation of rotor machine shafts misalignment does not depend solely on the type of misalignment (see Picture 1), but also on the way in which the shafts are connected to each other, namely on the type of coupling. The main types of coupling found in rotor machines are rigid, flexible and toothed. For example, flexible couplings allow a certain degree of misalignment between connected shafts, thus misalignment components may not be visible on the spectrum (simultaneously, however, such misalignment does not have to be harmful). In the case of shafts connected with discs, in addition to 2x frequency, misalignment is often accompanied by subsequent even harmonics, especially the 4x component [1]. In the case of toothed coupling, the frequency generated on the spectrum often depends on the number of teeth (so-called spikes) of the coupling. Nevertheless, it is worth remembering that many industrial machines were modernized during the exploitation (with regard to the original construction), which makes the impact of misalignment on the dynamics of a rotating shaft lower than expected, as exemplified by a ventilator drive with a disc coupling, in which an elastic disc was used [2]. On the other hand, even with both shafts aligned, misalignment in loaded systems may occur because of an uneven distribution of stiffness, even by applying grooves [3].
Another difficulty in detecting and identifying misalignment is the misalignment of shafts connected with a toothed gear. As indicated in table 2.1 in [3], it is possible that misalignment reduces the 2x component for just one shaft, additionally introduces crucial changes in the 1x component in both shafts, which indicates that in many configurations misalignment and unbalance are both acting on each other – which complicates the diagnostic process.
In order to solve this problem within measuring vibrations, the direction of vibrations is being additionally measured, which is also a component that influences the shape of a misaligned machine spectrum. According to norm (for example ISO 20816), misalignment should be tracked both in the vertical axis (similarly to unbalance) and the horizontal axis. It is worth noting that due to previously described factors ( type of misalignment, type and parameters of work), the values of each harmonics on the spectrum for the measurements in the horizontal and vertical directions, may significantly vary from each other. This is why misalignment is precisely identified by identifying the change of phase for the 2x component in the horizontal direction (the goal is to distinguish misalignment from unbalance, the change in phase typically does not occur for the latter). Alternatively, alongside vibration measurement, the problem of misalignment is often solved with the help of portable laser devices.
Laboratory example
Picture 4 depicts the AV TEST BENCH stand, which enables us to introduce controlled misalignment by misaligning the position of two parts of the stand, that is in the way that the fast shaft (FS) is misaligned in regard to the Slow Shaft (SS) connected with a flexible coupling. During measurement, the rotational speed of the fast drive shaft was 3000 RPM, according to the gear ratio (which is 23/67) the speed of the slow shaft was 3000 RPM * 23/67 = 1030 RPM. The measurement took place on the external part of the rolling bearing marked in Picture 5.

Picture 5. Introducing misalignment on the AV TEST BENCH stand
Picture 6a shows a part of the reference frequency spectrum for an aligned setup, and picture 6b shows an analogical part of the frequency spectrum for the misaligned setup.
Harmonic cursor
As exemplified in Picture 6 by misalignment, the diagnostic analysis uses different types of cursors, e.g. single cursor, double cursor (informs us about the gap in the given domain), harmonic cursor and sideband cursor. In this post, we used a harmonic cursor in the VIBnavigator environment.
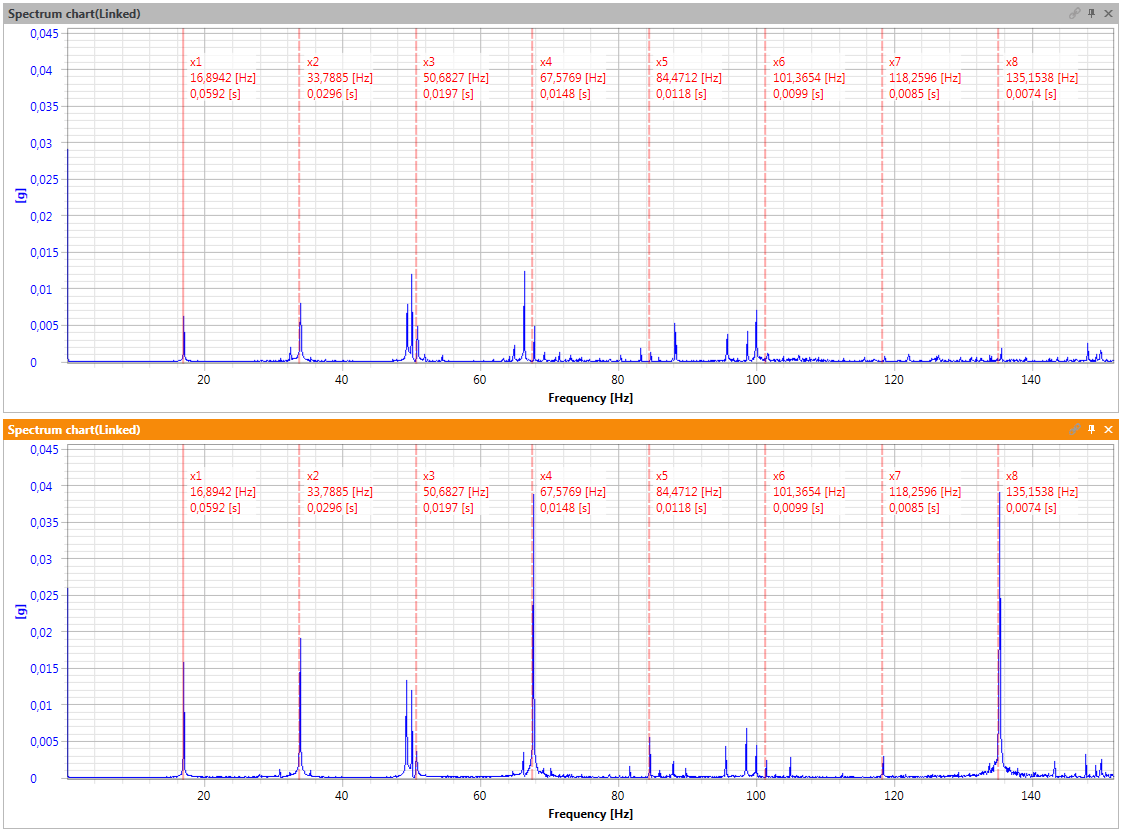
Picture 6. The spectrum of a rotor machine in the correct state (a-top) and misaligned (b-bottom)
Picture 6 indicates that in the misaligned machine even the harmonics of the slow shaft increase. The most noticeable increase happened for the 8 and 4 harmonics because the flexible coupling had 4 teeth (spikes). The only reason behind the inaccurate coinciding of the cursor values is that the cursors were marginally moved for better visibility of components. Measurements were done subsequently and describe a machine that differs only by the level of misalignment.
Use of measuring apparatus
The AMC VIBRO company offers detection, identification as well as evaluation of the level of misalignment component as a component defined by the user, and as a characteristic component automatically calculated by the system based on the kinetostatic model.
Table 2.1 Juxtaposition of AVM family devices, based on the characteristic frequency
|
|
|
|
|
| Misalignment detection using VRMS analysis | ✔️ | ✔️ | ✔️ |
| Detection and identification with Shaft 2x analysis in the manually configured frequency domain | ✔️ | ✔️ | |
| Detection and identification with Shaft 2x analysis in manually configured order domain | ✔️ | ✔️ | |
| Detection and identification with Shaft 2x analysis in the automatically configured frequency domain | ✔️ | ||
| Detection and identification with Shaft 2x analysis in automatically configured order domain | ✔️ | ||
| Single cursor | ✔️ | ✔️ | |
| Double cursor | ✔️ | ✔️ | |
| Harmonic cursor | ✔️ | ✔️ | |
| Sideband cursor | ✔️ | ✔️ |
Literature
[1]Dewell L., Mitchell L. D., Detection of a misaligned disk coupling using spectrum analysis. Journal of Vibration, Acoustics, Stress, and Reliability in Design, 106, 1983
[2]Zachwieja J., Analiza dynamiki wentylatora promieniowego w warunkach niewspółosiowości wałów wirnika i silnika, Diagnostyka 1 (53)/2010
[3]B. Randall, Vibration-based condition monitoring, John Wiley & Sons, Ltd., 2011
Book recommendation